

VIDEO
Aquarius to Measure Oceans’ Salinity
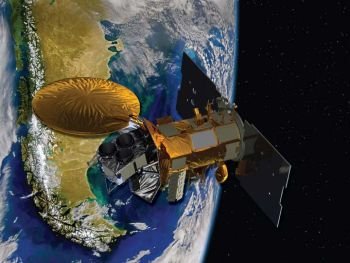
Aquarius measures the salinity of the ocean surface all over Earth
Salinity
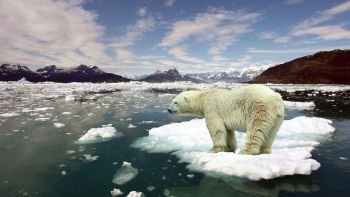
When large masses of ice melt, they add freshwater to the oceans. One way to tell if large masses of ice are melting is to monitor the salinity of adjoining areas of the seas.
The oceans are about 3.5 percent salt-mostly sodium chloride, with some other “salts” such as magnesium sulfate mixed in. The salt content of the oceans is a good chemical signature that can identify flow patterns such as ocean currents.
The boundaries of the Gulf Stream can be distinguished by abrupt changes in salinity. A lower salt concentration can mean that freshwater such as from glacial melt or increased precipitation is coming into seawater. A higher salt concentration can mean that above-average evaporation is removing water and leaving a more salty mix behind.
Based on millions of measurements, scientists are finding that the oceans are freshening. This is a growing concern because the great ocean currents such as the Gulf Stream depend on salinity differences to keep them moving. Modifications to the salinity patterns in the ocean may affect these currents in ways that are hard to predict. Some scientists believe that abrupt climate changes may have been triggered by the sudden release of fresh melt water in the past and that this may happen again.
Sea Level
How Sea Level Is Measured
Sea level around the world has increased by a small but measurable and statistically significant amount. It is not enough of an increase to affect any coastal areas or to even be noticeable. It is premature to look for consequences of sea level rise just yet. But scientists are now able to detect small changes in the sea level-both from sea gauges and from satellites in earth orbit.
With the beginning of the nineteenth century, the global average sea level, according to gauge measurements, began to rise at a slow but steady rate of 1.7 mm (only slightly more than 1/16 in) per year. Archaeological records from the Mediterranean region suggest that sea level had been fairly stable for the 2000-3000 years prior to about 1870. The seas already had risen by about 120 mm (nearly 4 ft) since the last ice age approximately 21,000 years ago.
Think for a second about what is even meant by sea level. First of all, the seas are not even close to level and certainly not fl at to within a few millimeters. There are continuous waves, swelling of the ocean surface, and periods of calm and storm.
How can scientists measure a difference of a few millimeters a year? The noisy background superimposed on the surface of the sea, that is, waves, swelling, and calms and storms, must be factored out of the measurement, along with the tides. We are looking for changes on the order of a millimeter each year. By taking a large enough statistical sample, through, the trend pictured in Figure 3-4 emerges. Global sea level rose at an average rate of 1.8 mm per year between 1961 and 2003 (just a tad faster than the rate since 1800).


