

CARING FOR CLIMATE – BUSINESS FORUM – UNEP
The Big Ask: Climate change, “ACT NOW!”
Climate Now (1)
The relatively mild weather of the past two millennia aided the development of human civilization. The byproduct of that development has been the rapid rise of greenhouse gas emissions in the past one and a half centuries. These papers explore climate change in recent times, particularly in the past few decades, during which the climatic effects of those emissions have been very apparent.
Recent Climate
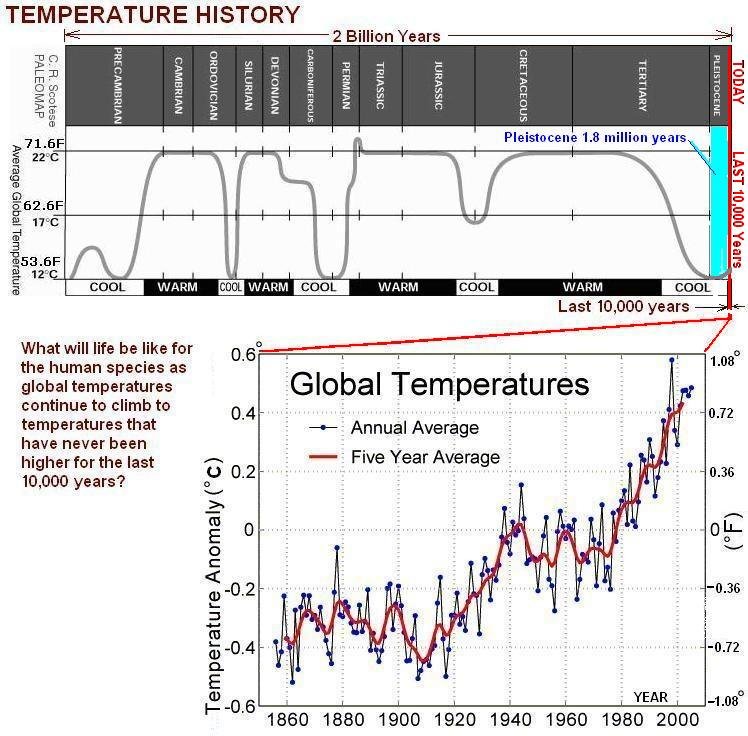
Over the past 10,000 years, global temperature rose 7°F (4°C). And one-seventh of that temperature rise, 1°F (0.6°C), occurred within a period of only 100 years: between 1900 and 2000. The twentieth century temperature rise was not uniform over time. Temperatures rose for the first 40 years, and then decreased slightly over the next 25. However, since the early 1970s, temperatures have risen abruptly, with an increase of about 0.7°F (0.4°C), including a major upswing beginning in 1990.
The graph of temperatures over the past 1,000 years is known as “the hockey stick graph,” a name that at least somewhat describes its shape. The graph shows greater rise in temperature and higher temperatures in the past two decades than at any time, including the Medieval Warm Period (MWP). This finding is supported by a 2006 report of the U.S. National Academy of Sciences.
Recent scientific evidence shows that the past 10- to 20-year period was the warmest period of at least the past two millennia. A look at average global temperatures from the time record keeping began in 1880 through 2006 shows that the 12 hottest years occurred since 1990. Indeed, every year since 1994 is on the list of 20, and only one of the top 20 hottest years was before 1983 (1944, at number 19). Temperatures have increased in both summer and winter. July 2006 was the second hottest July ever recorded in the United States, through 2006. (The previous hottest July temperatures occurred in 1936, at the peak of the Dust Bowl.) The average global temperature of 77.2°F (25.1°C) for July 2006 was just slightly lower than the July record average temperature of 77.5°F (25.3°C) and much higher than the historical average of 74.3°F (23.5°C). About 2,300 records were set for daily high temperatures and 3,200 for highest low temperatures. Europe also experienced a heat wave, and the Netherlands, Belgium, Ireland, and the United Kingdom had their hottest July ever.
The following winter, from December 2006 through February 2007, was the warmest winter on record worldwide, although temperatures were near normal in the United States. The winter from December 2005 to February 2006 was one of the warmest ever in the United States, and January 2006 was the warmest of that month on record.
The reason temperatures were so high that January was because of the jet stream. (The jet stream is a stream of air high in the atmosphere that separates cold temperatures in the north from warm temperatures in the south.) Ordinarily, if temperatures are unusually warm in one location, they are unusually cold in another, depending on the location of the jet stream. But that month the jet stream was extremely far north, so warm temperatures prevailed all over North America.
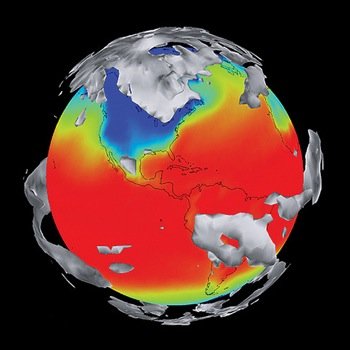
Recent rising temperatures have not been spread evenly around the Earth. The high latitudes have warmed most dramatically. In the past two decades, temperatures have risen as much as 8°F (4.4°C) in some Arctic locations. Some industrialized countries, such as the United States, have warmed less than the rest of the world, probably due to global dimming. While most locations have warmed, a few, such as the North Atlantic Ocean, have cooled.
Warmer temperatures have increased precipitation overall, but not uniformly. Average precipitation over the land has increased by about 2% since 1900. The mid and high latitudes over the Northern Hemisphere have experienced an increase in precipitation of 0.5 to 1.0% per decade, while tropical and subtropical regions have had a decrease of about 0.3% per decade. The number of heavy downpours (2 inches [5 cm] of rain in a single day) in the United States increased by 25% between 1900 and 2000.
As temperatures have risen, Northern Hemisphere snow cover has decreased by about 10% since the late 1960s and 1970s. The greatest decline is seen in spring: For example, 75% of sites in western North America have seen a reduction in springtime snowfall since 1950. Declining snow cover has also been found in Eurasia, including the Alps.Ocean temperatures are rising at the surface and into the mid-depths.
From 1955 to 1998, the upper 9,800 feet (3,000 m) of the ocean warmed by an average of about 0.067°F (0.037°C). While this may not seem like much, water’s high heat capacity and the vastness of the seas mean that even a small temperature increase requires a large amount of heat. Climate models show that the oceans have absorbed 20 times as much heat as the atmosphere in the past 50 years.
Climate Now
Causes of Recent Climate Change
The rate of temperature increase is faster than it has been in at least one millennium and most likely faster than in two or more. When scientists construct climate models to reproduce the changes that are taking place, inputting only natural causes of climate change is not sufficient to replicate current conditions. Models that input only human-generated causes of climate change are also not sufficient. To reconstruct recent warming trends, models must take into account both natural climate variations and the rise in greenhouse gas levels due to human activities.
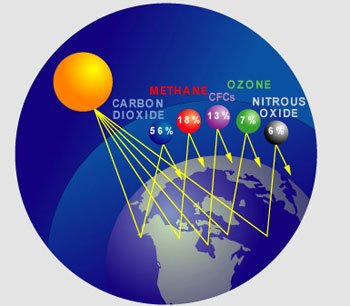
Greenhouse gases have carried far more weight in determining modern climate than any other factor in the warming seen since 1950. Due to increased fossil fuel and biomass burning, atmospheric CO2 has been rising sharply since the Industrial Revolution. The total increase for that time period is 27%, from the preindustrial value of 280 ppm to the January 2007 value of 382 ppm. Nearly 65% of that rise has been since CO2 was first measured on Mauna Loa volcano in Hawaii in 1958, when the value was 316 ppm. In fact, the rate of increase in CO2 has doubled from 30 years ago. One of the largest single-year increases on record – a rise of 2.6 ppm was in 2005.
The increase in atmospheric CO2 measured above Mauna Loa since 1958 is known as the Keeling curve. The up-and-down annual cycle A comparison between modeled and observed temperature rises between 1860 and 2000. The red line is the same in each graph; it is the observed temperature as measured by thermometers. In the first graph, the blue line shows the temperature that was modeled for that time period using only natural causes of warming. The temperature rise cannot be explained by natural causes alone. In the second graph, the blue line shows the temperature that was modeled for that time period using human activities (greenhouse gas emissions, primarily). The temperatures observed in the early- to mid-twentieth century cannot be explained by human activity alone.
In the third graph, the blue line shows the temperature that was modeled for both natural causes and human activities. This is the best fit and shows that both categories of change are needed to model the temperature rise of the past 140 years. is the result of the seasons. Most of the planet’s land masses lie in the Northern Hemisphere. In spring, when the North Pole points toward the Sun, trees sprout leaves and grasses multiply. The growing plants absorb CO2 from the atmosphere. In autumn, as the plants die back, the CO2 is rereleased into the atmosphere. Like CO2, methane amounts have risen since the Industrial Revolution; in this case, 151%, mostly from agricultural sources.
Scientists studying Greenland ice cores discovered in 2006 that there is more CO2 in the atmosphere now than at any time in the past 650,000 years. During all that time, in fact, CO2 had never risen above 300 ppm. Analyses of Antarctic ice cores show that levels of the three most important greenhouse gases (CO2, methane, and nitrous oxide) were never as high as they are today. It is important to note that greenhouse gases remain in the atmosphere for centuries.
When modeling recent climate change, scientists must take into account global dimming, which has the opposite effect on the climate from greenhouse warming. Global dimming causes a decrease in warming equal to about one-third the increase caused by greenhouse gases. The abundance of sulfate aerosols over the developed nations may explain why the Northern Hemisphere has warmed less than Southern Hemisphere; why the United States has experienced less warming than the rest of world; and why most global warming has occurred at night and not during the day, especially over polluted areas. Of course, air pollution has harmful effects on the environment and human health. As a result, people in developed nations now regulate emissions so that the air above them and downwind is much less polluted. However, a decrease in air pollution also brings about a decrease in global dimming, and a decrease in global dimming is likely to increase global warming. Global dimming researchers think that recent improvements in the air quality of Western Europe may be responsible for recent temperature increases and even for the deadly European heat wave of the summer of 2003.

