

Climate Change Temperature and Precipitation throughout the 21st century
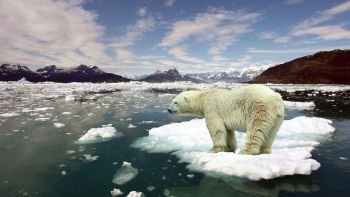
Melting Ice and Snow (3)
Impact on Wildlife-Some Examples
PRECIPITATION
Higher temperatures promote more evaporation. Overall, the total amount of global precipitation does not show an increase. However, there is a statistical increase in the incidence of heavy (95th percentile) and very heavy (99th percentile) precipitation events worldwide – in terms of extreme events and total annual rainfall.
This shows the change in the percentage of very wet days compared with a running baseline of 22.5 percent established from 1951–2003.
It is drier in the Sahel, the Mediterranean, and southern Asia. It is wetter in North America and western Europe. Precipitation has been increasing in the mid latitudes, including eastern North and South America, northern Europe, and northern and central Asia. For every 1°C rise in air temperature, the atmosphere can hold an additional 7 percent water vapor. An increase in air temperature over bodies of water can increase evaporation. This can create conditions that promote more precipitation.
The higher atmospheric temperatures also can enhance evaporation from soil, leaving it prone to drought. Whether there are moist or dry conditions depends on other climate factors such as El Nino or the NAO.
DETECTING CHANGES IN THE WEATHER
Measuring changes in weather conditions is in some ways similar to trying to determine whether the tide is coming in or going out. Suppose that we are sitting on the beach watching the waves. We may be very conscientious and watch closely for a half hour and conclude that the tide is not moving. We even may conclude that we do not believe in tides and think the whole thing is a myth. If we wait long enough, we will find that our beach blanket is soaked and our cooler is floating out to sea. Had we measured the furthest extent the water encroached on the sand and the furthest retreat back to sea, we would find a statistical correlation sooner than looking for a more dramatic overall movement. As with weather patterns, there are natural cycles of the spring and neap tides and the impact of local conditions such as storm.
What may appear to be a change in climate actually may be a temporary condition caused by El Niño or other climate cycles. The onset of climate change is often found in statistical correlations rather than in more conspicuous changes to weather.
WATER VAPOR
Higher temperatures cause an increase in atmospheric water vapor, which, in turn, leads to even higher temperatures. Every 10 years, the atmosphere holds 1.2 percent more water than the previous decade. The relative humidity of the atmosphere has remained pretty much constant, but a greater amount of water is held in the atmosphere as sea temperatures increase. Water vapor is a natural greenhouse gas.
WARM DAYS
The year 2005 was one of the warmest on record. Eleven of the past 12 years (through 2006) were the warmest since 1850. Since 1950, the number of heat waves has increased. Probably the clearest weather-related trend is toward a decline in the number of coldest days (and nights) and an increase in the number of warmest days (and nights). There have been a greater average number of warm nights and a smaller average number of cool nights worldwide since 1951. The data show the number of extremely warm days worldwide, defined as being above the 90th percentile.
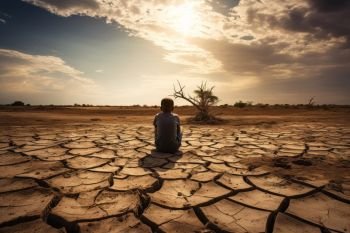
DROUGHT
Drought has become more common, especially in the tropics, since 1970. Droughts are becoming longer and more severe and are affecting a wider area. This is consistent with decreased precipitation in some areas and higher temperatures causing drying conditions. Increasing sea surface temperatures and loss of snow are direct contributors to drought. An index called the Palmer Drought Severity Index (PDSI) is used to compare the extent of local loss of surface land moisture. Drought conditions overall have been increasing worldwide since 1900. Some regions, such as the southern part of South America, are not seeing drought but rather an increase in moisture. However, more areas than not are seeing drying conditions. The smooth line through the data shows a pattern of natural increases and decreases on the time scale of decades. The dominant pattern that emerges through the natural variations is a trend toward more severe drought conditions worldwide.
Key Ideas
• Average global sea surface temperatures increased by 0.35°C from 1961 to 2003.
• It takes more heat to change the temperature of a given volume of water than it does for an equal volume of air.
• The earth’s oceans absorb 20 times as much heat as the atmosphere.
• The pH level in the earth’s oceans has increased, indicating an increased absorption of carbon dioxide.
• Local salinity increases indicate freshening of seawater from glacier and ice-cap melting.
• The average global sea level has increased by 1.7 mms (0.07 in) per year since the 1800s (1.8 mm per year since 1961–2003).
• Recent satellite measurements indicate that the average global sea level is currently increasing at 3 mm (0.12 in) each year.
• The average global sea level has increased by 120 mm (4.7 in) since the last ice age.
• Sea level rises for two reasons:
(a) Water expands when it gets warmer,
(b) Water volume increases from melt water. Each contributes in equal proportions to sea level increase.
• Arctic sea ice is 7.4 percent less in summer and 2.7% less overall than 10 years ago.
• If floating ice such as the Arctic ice cap melts, global sea level will not be affected.
• Rivers and lakes are freezing 5.8 days later and are thawing 6.5 days sooner each year than 100 years ago.
• Snow cover in the northern hemisphere is decreasing by about 5 percent each year.
• Albedo (percent of light reflected) for fresh snow is 80 to 90 percent and for melting ice is 50 to 60 percent.
• Greenland is showing 5–10 more melt days each year (than between 1988 and 2005).
• If all the snow and ice in Greenland melted, global sea level would increase 7.3 meters (24 feet)
• Despite breakup of some ice sheets in the western part of Antarctica, signs of massive melting have not been identified.
