

National Geographic – Killer Hurricanes 720p
Earth Under Water – Worldwide Flooding – Global Warming – National Geographic
HURRICANE – NATIONAL GEOGRAPHIC
FLOOD – RAIN – EUROPE – NATIONAL GEOGRAPHIC
Visible Effects of Climate Change
Floods
While warming has parched some regions, others have experienced increased flooding. There were 10 times as many catastrophic floods between 1990 and 2000 globally than in an average decade between 1950 and 1985. The number of people affected by floods worldwide has risen to 150 million from 7 million in the 1960s.
The increase has mostly taken place on the world’s largest rivers. The 1993 Mississippi River flood was the most damaging in United States history due to recent development along the river.
The river basin received between two and six times the normal amount of rainfall-so much rain that the ground became too saturated to absorb more water, and local streams began to overflow.
As many as 150 levees, protecting over 6,000 miles (9,300 km) of the Mississippi and its tributaries, failed. However, not all levees broke, and low-lying areas in Davenport, Iowa; Rock Island, Illinois; and Hannibal, Missouri, among others, were saved. At least some of the extreme flooding was caused by the 80% loss of Mississippi River basin wetlands, which once acted as natural floodwater storage.
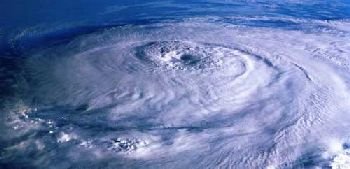
Hurricanes
The costliest and most visible change in weather-related disasters in the United States is the increase in the number of intense hurricanes making landfall from the Atlantic basin. Similar increases are also occurring in the Pacific basin.
Hurricanes are born in summer and autumn when a vast area of the sea surface rises to 82°F (28°C) or higher, and winds are light. The warm seawater heats the air above it, causing the air to rise. The column of air spirals upward, feeding on the heat energy from the tropical waters. For the storm to grow there must be little or no wind shear between the lower and upper atmosphere; high wind shear will decapitate the storm.
Hurricanes can grow to 350 miles (600 km) in diameter and 50,000 feet (15 km) in height. Hurricanes are categorized on the Saffir-Simpson scale. Wind speed is highly significant because a storm with 130-miles-per-hour (209 kph) winds has almost doubled the strength of one with 100-miles-per-hour (160 kph) winds. As a result, although they are only 20% of the storms that make landfall, Category 4 and 5 storms produce more than 80% of the damage from hurricanes. Rainfall of one inch (2.5 cm) per hour is not uncommon in a large storm, and a single hurricane may produce a deluge of up to 22 billion tons (20 billion metric tons) of water a day. Hurricanes typically last 5 to 10 days but may last up to three weeks. Once these mighty storms are cut off from warm water, they lose strength, so they die fairly quickly over cooler water or land.
Damage comes from the impact of these storms on the ocean as well. Category 4 and 5 hurricanes can generate storm surges of 20 to 25 feet (7.0 to 7.6 m) for a distance of 50 to 100 miles (80 to 160 km) along a coastline. Giant waves, up to 50 feet (15 m) high, ride A top storm surges and cause even greater damage. In areas of low elevation as is typical of the Atlantic and Gulf Coasts of the United States, which rise less than 10 feet (3 m) above sea level flooding may be devastating.
A typical Atlantic season spawns six hurricanes and many smaller tropical storms. On average, one hurricane strikes the United States coastline three times in every five years (that is, there is a 60% chance of a hurricane striking the coastline in any given year). But few hurricane seasons are typical. A cycle of high activity from the 1920s through the 1960s was followed by low activity between 1971 and 1994. Nevertheless, major storms can form during quiet periods, as was shown when Hurricane Andrew devastated South Florida in 1992.
Since 1995, conditions have become much more favorable for hurricane growth. Between 1995 and 2000, hurricanes formed at a rate twice as great as during the most recent quiet period, and the Caribbean experienced a fivefold increase. Some hurricane experts attribute variations in storm number to natural climate variation, such as the Atlantic Multidecadal Oscillation (AMO), rather than to global warming.
Still, many experts blame global warming for other changes in hurricanes. A 2005 study in the journal Nature, by Kerry Emanuel of the Massachusetts Institute of Technology, shows that hurricanes have increased in duration and intensity by about 50% since the 1970s. The number of Category 4 and 5 hurricanes jumped from 50 per five years during the 1970s to 90 per five years since 1995. The jump was even higher in the North Atlantic, from 16 strong hurricanes between 1975 and 1989 to 26 between 1990 and 2004.
Emanuel’s study and others have shown that hurricane number may be related to some other climate oscillation, but that hurricane intensity is related to global warming. Seasons with high SST and global air temperature have intense storms. Rising temperatures also cause these mammoth storms to last longer. These effects of increased storm intensity and duration are predicted by computer models of rising SST.
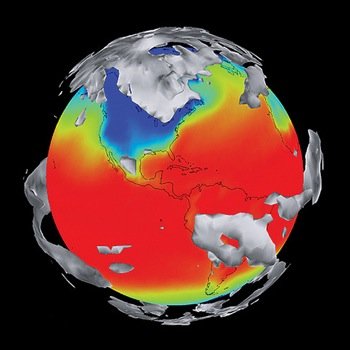
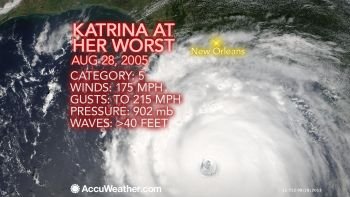
In the hurricane season of 2005, SST in the critical portions of the Atlantic basin were 1.6°F (0.9°C) higher than was the average between 1901 and 1970. Not surprisingly, perhaps, the 2005 hurricane season has become known as the longest and most damaging season ever (through 2006). The 2005 season lasted weeks past the normal end of hurricane season. There were so many storms that, for the first time, the World Meteorological Organization ran out of the 21 previously chosen names that are available each hurricane season, Sea surface temperature view, showing Hurricane Katrina as it moves over Gulf of Mexico waters on its way to the Louisiana and Mississippi coasts, August 27, 2005. Color indicates water temperature, with deep oranges as the hottest temperatures and deep blues as the coldest. (NASA/Goddard Space Flight Center Scientific Visualization Studio) Effects of Climate Change on the Atmosphere and Hydrosphere with the result that six storms needed to be identified by letters of the Greek alphabet. Seven major hurricanes made landfall, resulting in nearly 2,300 deaths and damages of more than $100 billion. Hurricane Wilma was the most intense storm ever recorded, and the third costliest. The costliest, Hurricane Katrina, was the most damaging natural disaster to strike the United States to date. (But not the deadliest: The hurricane that hit Galveston, Texas, in 1900 is estimated to have killed more than 6,000 people. That high death toll was due, in part, to the fact that it took place long before meteorologists were able to predict hurricanes.)
A study by Kevin Trenberth and Dennis Shea of the National Center for Atmospheric Research, in Boulder, Colorado, published in Geophysical Research Letters in 2006, analyzed the reasons the 2005 season was so unusual. It suggests that global warming played the biggest role, with a smaller effect from a Pacific El Niño and a still smaller effect from the AMO. Climate scientists will likely be debating the relative impacts of global warming and other factors regarding hurricanes for years to come.
The United States is not the only location experiencing unusual hurricane activity. In 2004, Japan experienced 10 typhoons, three more than the greatest number ever recorded. Also that year, for the first time, a hurricane formed in the South Atlantic. That storm, called Hurricane Catarina, hit Brazil.
Wrap-Up
Earth is always changing, on both long and short timescales. Glaciers grow and melt, sea level rises and falls, and hurricanes come and go. But the adjectives are starting to line up: The hottest, driest, wettest, and stormiest weather in history is being experienced in many different locales. These phenomena are pointing in one direction; the effects of global warming are becoming apparent and more intense in the atmosphere and the hydrosphere. And such changes are beginning to take a toll on the biosphere.
