

EL NIÑO AND LA NIÑA/ENSO
Climate Oscillations-Swinging between Two Extremes
El Niño, a part of the climate system, is a naturally occurring cycle in the equatorial Pacific Ocean that repeats roughly every 2-8 years. El Niño is part of a climate cycle called the southern oscillation. The cycle varies between two extreme conditions:
El Niño and La Niña. El Niño is Spanish meaning “the child.” South American fishermen gave this weather phenomenon its name at Christmas time, when milder than normal conditions prevailed in western Peru. La Niña means “the sister” and is the other part of the cycle, when the opposite, more severe weather conditions prevail. The term normal year in this context is sometimes used to denote conditions that are roughly midway between the El Niño and La Niña extreme points of the cycle.
El Niño and La Niña are closely related. They are both part of a long-term climate pattern that meteorologists call an oscillation. El Niño and La Niña are part of an oscillation called the southern oscillation that was first noticed by the British meteorologist Gilbert Walker in the 1920s. Walker, who was stationed at the time in India, wanted to understand what caused the monsoon season in the southern part of Asia to be severe or mild. Walker noticed that when there was a strong monsoon season in Asia, there were, at the same time, severe droughts in Australia, Indonesia, and parts of Africa. Looking into this further, Walker observed that high air pressure in the eastern Pacific occurred at the same time as low pressure in the western Pacific. These conditions continuously reversed themselves like a child’s playground swing going back and forth. This ongoing pattern determines, for instance, whether people in North America will be getting out their snow shovels during the winter or seeing a relentless barrage of hurricanes during the summer.
The southern oscillation, El Niño, and La Niña are all considered to be part of the same condition. For this reason, climatologists refer to it as the El Niño southern oscillation (ENSO). The mechanism that drives the ENSO, as with other climatic oscillations, is a complex interaction between the atmosphere and the ocean. Air pressure differences affect ocean currents both along the surface and vertically, which affect water surface conditions. It is not always easy for the air to push the ocean, so there can be a delayed reaction from the atmospheric influence until the ocean responds.
Once the ocean changes, though, it influences air conditions. This continuing dance between the ocean and atmosphere results in a restoring influence that makes the ENSO a recurring phenomenon.
The ENSO Climate Pattern
During the El Niño part of the cycle, certain regions of the Pacific Ocean become warmer than usual. Trade winds and ocean currents change from their typical patterns. This brings abnormal and at times extreme weather to various parts of the world. During La Niña, the opposite occurs, and the ocean is colder than usual.
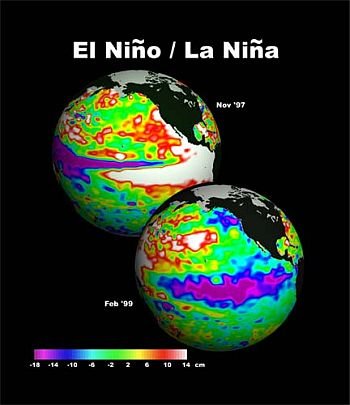
Near the equator, the trade winds normally blow from East to West. El Niño conditions weaken or reverse this pattern, to produce a West-to-East flow. El Niño can have a significant impact on the earth’s climate. During El Niño events, the average global temperatures can increase by 0.1–0.2°C (0.2–0.4°F). This is different from the global warming caused by greenhouse gases because the ENSO temperature change is part of a repeating cycle rather than a progressively increasing trend. The ENSO affects climate throughout the world. During El Niño years, winters in North America are milder, the southeastern United States and Peru get more precipitation, and there are fewer Atlantic hurricanes. There is drought in the western Pacific and Australia, which under the most severe conditions leads to forest and brush fires. Because of the trade wind patterns, the sea level is 0.5 m (1.6 feet) higher in Indonesia than in Ecuador, and sea surface temperatures are 8°C (14.4°F) higher in the western than in the eastern Pacific. Cooler ocean temperatures produce upwelling off South America, which brings nutrients to the surface. Warm air near Peru rises, producing heavier local rainfall. An air pressure difference between the Pacific island of Tahiti and Darwin, Australia, is the official indicator of the onset of El Niño conditions.
La Niña is the opposite side of the coin. Sea surface temperatures near the equator are as much as 4°C (7°F) below normal. Parts of Australia and Indonesia have greater precipitation during La Niña years in contrast to the drought that often characterizes the El Niño years. During La Niña, there are drier conditions in the southwestern United States in late summer and winter. The Pacific Northwest is likely to be wetter than normal. La Niña winters are warmer than normal in the Southeast and colder than normal in the Northwest.
The U.S. National Oceanic and Atmospheric Administration (NOAA) tracks ENSO conditions by using a network of buoys along the equator between the 10 degree N and 10 degree S parallels. These buoys measure temperature, water current, and wind. Satellites also measure sea surface temperature and wave height patterns. The ENSO is a periodic phenomenon that affects climate worldwide. It is not a cause of global warming in the sense that we are referring to global warming in this book. Although the global mean temperature can be higher during El Niño years, the increase is transient. The ENSO is a pattern that-like several others-is superimposed on the overall pattern of global warming. As global warming progresses, El Niño years may be warmer and La Niña years may be less severe in their effect. El Niño can have devastating effects, producing droughts in some areas and flooding in others. It has completely wiped out the fishing industry in certain areas of the world.
1982-1983 EL NIÑO EVENTS
The following are some of the specific effects attributed to this El Niño event:
• An outbreak of encephalitis caused by a warm, wet spring along the East Coast of the United States
• An increase in snake bites in Montana as the hot, dry weather drove mice from higher elevations in search of food and water, and the rattlesnakes followed
• An increase in shark attacks off the Oregon coast owing to unseasonably warm ocean temperatures
• An increase in cholera in Bangladesh
• An increase in typhoid, shigellosis, and hepatitis in South America
• An increase in viral encephalitis in Australia
(Source: NASA.)
The ENSO results in altered weather patterns worldwide producing a wide range of climate modifications that show up in various regions during specific seasons. Relationship between the ENSO and Climate Change Scientists are looking into whether global warming is helping to promote the onset of ENSO conditions. There is also the concern that the effects of increased ocean surface temperatures caused by global warming will be exacerbated during El Niño years.
The result of global warming may be to put the El Niño conditions on steroids. If we think about the ENSO as a playground swing going back and forth between the conditions of El Niño and La Niña, global warming is like someone pushing that swing. Global warming is pushing the climate to the warmer side of the ENSO.
OTHER CLIMATIC OSCILLATIONS
The ENSO is just one of several similar recurring climate patterns. These include the North Atlantic oscillation (NAO), the northern annular mode (NAM), the southern annular mode (SAM), the Pacific–North American pattern (PNA), and the Pacific decadal oscillation (PDO). Like the ENSO, these patterns come and go and interact in ways that are actively being studied by climatologists around the world.
Natural climate cycles often last 10-20 years. Changes in climate must be tracked for at least several decades so as not to be confused with the effects of these natural cycles. Interpretation of possible relationships between global warming and local weather events needs to be done in the context of naturally occurring climatic cycles.
For instance, the coming and going of severe weather is often brought on by these oscillations. Many of the graphs in this book show an up-and-down roller-coaster pattern superimposed on a long-term trend. The up-and-down pattern is the effect of the oscillations.
Average global air temperatures take a few steps forward and a few steps back on their way up because of natural climate cycles such as El Niño. We should be careful not to blame a particularly devastating storm season or an unusually warm winter on global warming.