

“I am prepared for the worst, but hope for the best”.
Benjamin Disraeli
VIDEO
135 Years of Global Ocean Warming – Perspectives on Ocean Science

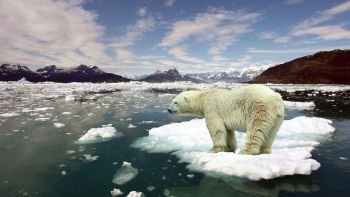
Signs of Global Warming
The Oceans
Ocean Temperature
Sea Surface Temperature
Direct and Indirect Evidence
All indications are that the earth’s atmosphere is warming. We might expect to observe other signs around the world that are consistent with this conclusion. Global ocean temperature and sea level are beginning to rise in small but measurable amounts.
Rapid melting of snow and ice observed in many parts of the world provides a more dramatic signal that global warming is underway. We will explore the signs of warming that are beginning to show up in various places around the world.
Here are a few brief examples:
• Glaciers and ice caps. Each year, enough fresh melt water is brought into the world’s oceans to raise sea level by 0.8 mm.
• Snow cover. Every 10 years, there is 2 percent less snow cover in the northern hemisphere than there was a decade before.
• Lakes and rivers. Each year, the world’s lakes and rivers are covered by ice 12 fewer days during the winter months than they were150 years ago.
• Permafrost. There is 7 percent less permanently frozen areas (permafrost) than there was in 1900.
• Spring. Leaves unfold, birds migrate, and birds lay eggs earlier every year.
The Oceans
Ocean Temperature
Sea Surface Temperature
As the temperature of earth’s atmosphere goes up, the average sea surface temperature is also rising. The sea surface refers to the top few meters of the ocean. Data are derived from satellites and through a global network of buoys.
The warmest year since these measurements began in 1856 was 1998. The five warmest years have occurred since 1995. Currently, the mean global sea surface temperature is about 0.35°C (0.6°F) above the 1961-1990 baselines. The sea surface is showing a similar pattern of increasing temperature as the atmosphere. Notice that in the early 1940s there were several warmer years. This is most likely the result of a series of El Nino events.
Most regions of the ocean have warmed with a few localized exceptions, such as the southern coast of Greenland. It is also important to note that the small changes in ocean temperature are consistent with the quantity of additional heat that is being absorbed by the earth.
Where the Heat Goes
Since 1960, the oceans have absorbed 20 times more heat energy than the atmosphere. Nearly 90 percent of the sun’s energy goes into the earth’s oceans. However, if we consider a layer of the ocean to a depth of 700 m (2300 ft), we find that the average temperature increase in that layer is much smaller.
The average global ocean temperature in an ocean layer 700 m deep has increased (from the period 1961–2003) by a meager 0.1°C (0.2°F). The oceans absorb an enormous amount of heat. But heat is not the same as temperature. It takes much more heat to change the ocean temperature than it takes to change the air temperature.
The ocean gets more heat from the sun but shows a more modest temperature change in response because of its greater heat capacity.
Had the oceans not been able to store as much heat as they do, the temperature of the atmosphere would have been much greater. Because of their greater size and ability to store heat, the oceans can hold a thousand times more heat overall than the atmosphere. The oceans are enormous, so the seemingly small increase in temperature represents a massive increase in the amount of heat energy in the earth’s climate system.
Acidity
The world’s oceans are becoming more acidic each year. The more acidic the oceans become, the less they are able to continue taking carbon dioxide out of the atmosphere. This is a direct result of carbon dioxide dissolving in water, which makes the water more acidic. As carbon dioxide increases in the atmosphere, more carbon dioxide dissolves in ocean waters. When carbon dioxide dissolves in water, it forms carbonic acid. This results in a lower pH of the world’s oceans. (More acidic conditions are indicated by a lower pH and more alkaline or basic conditions are indicated by a higher pH level.)
Biologists do not yet fully know the effect of increased pH on aquatic organisms. A typical pH range for seawater around the world is 7.9–8.3, which is slightly alkaline, or basic. Since 1750, the average pH range of the global oceans has decreased by 0.1, indicating a slight shift to being more acidic.
There is no evidence that the pH was ever more than 0.6 below the preindustrial levels during the past 300 million years. Scientists are concerned about potential impacts on sea life from decreased ocean pH level, especially if it continues to fall.
The Intergovernmental Panel on Climate Change (IPCC) predicts that increasing carbon dioxide levels in the atmosphere will raise ocean pH by 0.14–0.35 during the twenty-fi rst century. This is in addition to the 0.1 increase seen already.
To determine how ocean pH may affect the ocean ecosystem, scientists are using satellites to monitor the health of the oceans. Satellites are beginning to measure the extent of basic aquatic plant activity (in the form of phytoplankton consuming carbon dioxide, releasing oxygen, and producing food) in the ocean. Primary production is the basic ecologic process in which carbohydrates are produced by plants through photosynthesis. This forms the basis of the ocean food chain.
Satellites measure primary production by monitoring the very specific green wavelengths of visible light that indicate the presence of chlorophyll. Initial indications are that there has been a 6 percent decrease from the 1980s to the 1990s.
These data carry too much uncertainty to be a cause for alarm, but they are something that scientists will continue to monitor.


