

VIDEO
The Lies Of Global Warming pt 1
Tree-ring samples
It is common for students determine how old a tree is by counting the rings of a cross section cut from the tree’s trunk. Each year the tree adds a new ring that reveals clues about the climate at the time the tree was growing.
A wider ring would suggest a warmer growing season. Fortunately, researchers can withdraw a core the diameter of a pencil from a tree without killing it (so that the tree can, among other things, continue to remove carbon dioxide from the air). Tree-ring data do not go as far back in time as some of the other proxy temperature measurements. However, tree-ring data provide excellent detail in distinguishing individual yearly events.
Analysis of tree rings helps to put a more accurate time stamp on data derived from some of the other techniques for time periods where they overlap.
Coral Growth
Coral provides a unique perspective on past conditions in the ocean and offers a look at what may have occurred well before the instrumental record. Coral is a tiny sea animal whose skeletal remains are formed from calcium carbonate (Note that each coral is an individual animal and the reef is composed of their skeletons.) During the winter, skeletons that form in coral reefs have a different density than those formed in the summer because of variations in growth rates related to temperature and other conditions. Core samples taken from coral reefs exhibit seasonal growth bands that can be analyzed in a similar manner as those observed in trees. The different layers and their association with temperature changes.
Boreholes and Ocean Sediment
In most places around, the world ice layers are not available to provide historical climate data. To provide a more complete picture geographically, scientists study rock samples drilled from the earth’s crust. This type of borehole data is only able to detect changes from one century to another rather than the higher time resolution that comes from other proxy techniques. Borehole measurements confirm that the twentieth century was the warmest of the past five centuries and provide a basis for comparison from one region to another.
Each year, dust, plants, and animal skeletons settle on the ocean fl oor. Layers of sediment form a vertical record of past climates. In a similar manner, rock sediments reveal a timeline in continental areas, and careful extraction of vertical samples permits scientists to go back in time by analyzing the sediment layers.
Different Places, Different Temperature Changes
Northern and Southern Hemispheres
Land regions have shown greater warming than the oceans in the past few decades. This observation is consistent with the greater heat capacity of water compared with air. Since the northern hemisphere has a greater amount of land compared with water, it has shown a more definitive rise in temperature compared with the southern hemisphere. Historical records for the southern hemisphere are too limited to provide a similar comparison of recent temperatures and past climate patterns.
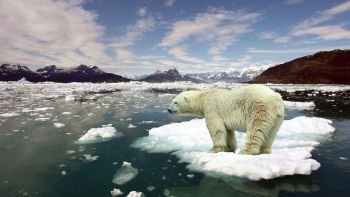
Global warming has been highest at the higher northern latitudes, with Arctic temperatures increasing at almost twice the rate of the rest of the earth during the past century. This may be the result in part of long-term changes in atmospheric and ocean currents that redistribute absorbed heat.
Averages over time or across the entire planet provide a useful way to simplify an otherwise apparently chaotic pattern. However, sometimes important information can be lost in the statistics. For instance, when the average temperature of the entire planet increases by 1°C some places may be warmer that year and other places colder. Usually, the North Pole heats up nearly twice as fast as the equator. Although there has been a warming trend, there have been recent years when for various reasons the earth was cooler. The warming trend has not affected the Antarctic region nearly as much as the northern latitudes.


