

“What’s the use of a fine house if you haven’t got a tolerable planet to put it on?”
― Henry David Thoreau, Familiar Letters
The Scariest, Most Shocking Climate Change Video of 2012: Skywatcher
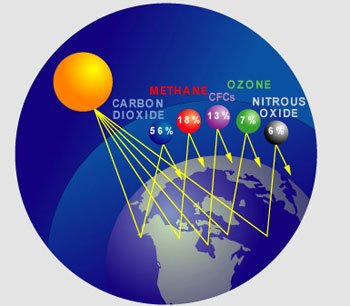
The relatively mild weather of the past two millennia aided the development of human civilization. The byproduct of that development has been the rapid rise of greenhouse gas emissions in the past one and a half centuries. Our papers explores climate change in recent times, particularly in the past few decades, during which the climatic effects of those emissions have been very apparent.
Recent Climate
Over the past 10,000 years, global temperature rose 7°F (4°C). And one-seventh of that temperature rise, 1°F (0.6°C), occurred within a period of only 100 years: between 1900 and 2000. The twentieth century temperature rise was not uniform over time. Temperatures rose for the first 40 years, and then decreased slightly over the next 25. However, since the early 1970s, temperatures have risen abruptly, with an increase of about 0.7°F (0.4°C), including a major upswing beginning in 1990.
The graph of temperatures over the past 1,000 years is known as “the hockey stick graph,” a name that at least somewhat describes its shape. The graph shows greater rise in temperature and higher temperatures in the past two decades than at any time, including the Medieval Warm Period (MWP). This finding is supported by a 2006 report of the U.S. National Academy of Sciences. Recent scientific evidence shows that the past 10- to 20-year period was the warmest period of at least the past two millennia.
A look at average global temperatures from the time record-keeping began in 1880 through 2006 shows that the 12 hottest years occurred since 1990. Indeed, every year since 1994 is on the list of 20, and only one of the top 20 hottest years was before 1983 (1944, at number 19).
Temperatures have increased in both summer and winter. July 2006 was the second hottest July ever recorded in the United States, through 2006. (The previous hottest July temperatures occurred in 1936, at the peak of the Dust Bowl.) The average global temperature of 77.2°F (25.1°C) for July 2006 was just slightly lower than the July record average temperature of 77.5°F (25.3°C) and much higher than the historical average of 74.3°F (23.5°C). About 2,300 records were set for daily high temperatures and 3,200 for highest low temperatures. Europe also experienced a heat wave, and the Netherlands, Belgium, Ireland, and the United Kingdom had their hottest July ever.
The following winter, from December 2006 through February 2007, was the warmest winter on record worldwide, although temperatures were near normal in the United States. The winter from December 2005 to February 2006 was one of the warmest ever in the United States, and January 2006 was the warmest of that month on record.
The reason temperatures were so high that January was because of the jet stream. (The jet stream is a stream of air high in the atmosphere that separates cold temperatures in the north from warm temperatures in the south.) Ordinarily, if temperatures are unusually warm in one location, they are unusually cold in another, depending on the location of the jet stream. But that month the jet stream was extremely far north, so warm temperatures prevailed all over North America. Recent rising temperatures have not been spread evenly around the Earth.
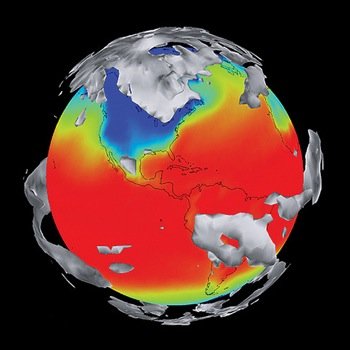
The high latitudes have warmed most dramatically. In the past two decades, temperatures have risen as much as 8°F (4.4°C) in some Arctic locations. Some industrialized countries, such as the United States, have warmed less than the rest of the world, probably due to global dimming. While most locations have warmed, a few, such as the North Atlantic Ocean, have cooled.
Warmer temperatures have increased precipitation overall, but not uniformly. Average precipitation over the land has increased by about 2% since 1900. The mid and high latitudes over the Northern Hemisphere have experienced an increase in precipitation of 0.5 to 1.0% per decade, while tropical and subtropical regions have had a decrease of about 0.3% per decade. The number of heavy downpours (2 inches [5 cm] of rain in a single day) in the United States increased by 25% between 1900 and 2000.
As temperatures have risen, Northern Hemisphere snow cover has decreased by about 10% since the late 1960s and 1970s. The greatest decline is seen in spring: For example, 75% of sites in western North America have seen a reduction in springtime snowfall since 1950. Declining snow cover has also been found in Eurasia, including the Alps.
Ocean temperatures are rising at the surface and into the mid-depths. From 1955 to 1998, the upper 9,800 feet (3,000 m) of the ocean warmed by an average of about 0.067°F (0.037°C). While this may not seem like much, water’s high heat capacity and the vastness of the seas mean that even a small temperature increase requires a large amount of heat. Climate models show that the oceans have absorbed 20 times as much heat as the atmosphere in the past 50 years.

